News
Traders model bullish moves for S&P 500 with tariff tensions easing
(Bloomberg) — The reprieve in US-China trade tensions that sent stocks soaring on Monday has chart watchers anticipating fresh all-time highs for the S&P 500 Index ( ^GSPC ).
The gauge closed above 5,750 — its 200-day moving average — for the first time since late March. According to John Kolovos, chief technical strategist at Macro Risk Advisors, there are now no more major resistance levels left until 6,144, the record high the S&P 500 hit on February 19.
So-called resistance levels occur at points where a bullish trend is expected to pause as selling surpasses buying. A break above those levels indicates a shift in sentiment.
Subscribe to the Bloomberg Daybreak Podcast on Apple, Spotify and other Podcast Platforms.
“The S&P 500 ( ^GSPC ) trading above the 200-day moving average is another indication that the trend is turning positive,” Kolovos said. “This increases the odds that pullbacks will be met with increased demand or buying interest. It changes your strategy and sends the signal that we’re done with the bear market.”
Major US indexes have already erased the losses they suffered since April 2, when President Donald Trump announced sweeping levies on imports, and are within 1% from wiping out their declines this year. Investors are now seeing the easing of trade tensions between the US and China as evidence of the Trump administration tempering their aggressive tariff policies.
The latest setup for the S&P 500 has changed how aggressive dip buyers could be if the stock market retreats from where it currently stands — because they expect equities to only rally further.
Predictions
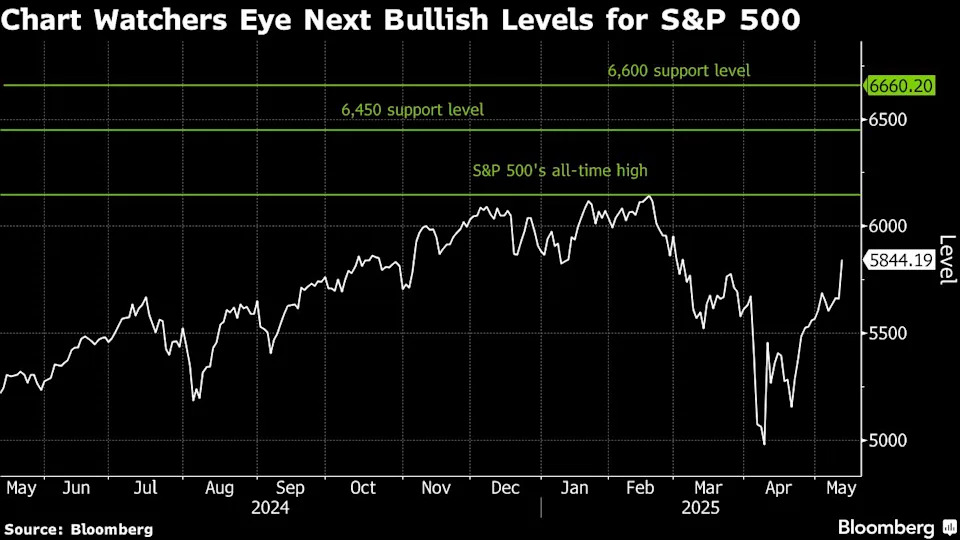
Chart watchers are already modeling what the next bullish levels will be if the S&P 500 breaks above its all-time high.
To Kolovos, it would pave the path for the index to hit 6,600. JC O’Hara, chief technical strategist at Roth Capital Partners, sees the next target being 6,450, followed by 6,645, implying a gain of more than 10% above Monday’s close.
Even so, if history is any guide, a move above the 200-day moving average doesn’t guarantee that stocks could move higher.
Nearly two-thirds of 14 S&P 500 bear markets since the World War II started with a double digit decline and recovered to within 2% or higher of the 200-day moving average — only to plunge once again around even lower levels, according to Sam Stovall, chief investment strategist at CFRA.
That strengthens the case for technical analysts to continue to watch so-called support levels, at which stock indexes typically bounce as they indicate potential buying. Last week’s high of 5,720 has turned into a major support level and a potential move below 5,580 would force the index to retest the 5,425 level, Kolovos said.
Positioning
Aggregate equity positioning is still only slightly above the bottom of its longer-run range going back to 2010, according to Deutsche Bank Securities ( DB ) strategist Parag Thatte. That means investors that cut their positions to stocks because of tariff-driven uncertainty would need to boost their exposure if they want to participate in a rally.
Bullish trends are already shaping up across systematic funds, which follow market direction and technical indicators.
Commodity trading advisors, or CTAs, are likely turning long on US equities after the market rallied through key momentum levels on Monday, JPMorgan Chase & Co.’s ( JPM ) Bram Kaplan wrote in a Monday note.
Any upcoming short-term dip will likely be bought, not sold, said Craig Johnson, chief market technician at Piper Sandler.
“‘Pain trade’ is now up as the sentiment has changed and the worst case scenario in form of deteriorating corporate earnings is likely not going to happen,” he said.