News
6 charts show the chaos in markets after Trump's sweeping trade war escalation
President Donald Trump's trade war has sparked chaos in markets.
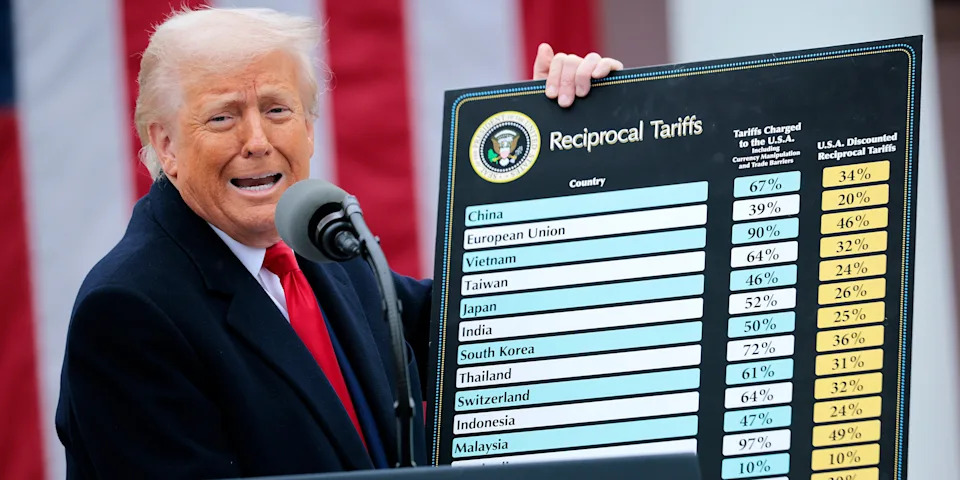
The president plowed ahead with sweeping tariffs, rolling out a fresh slate of new and reciprocal duties on America's top trading partners.
The latest tariffs include a 10% baseline tariff on all countries, as well as an additional 34% reciprocal tariff on China and an additional 20% tariff on the European Union.
Here are six charts that capture the impact on markets.
Stocks
The reaction on Wednesday evening was immediate, and futures were down sharply Thursday morning. The S&P 500 and Nasdaq Composite dropped more than 3%. The Dow Jones Industrial Average plummeted as much as 1,200 points.
Markets fear that earnings growth will take a dire hit in the coming months, as multinational companies with large global supply chains struggle. Apple was one of Thursday's biggest losers, down 8% before the opening bell.
Some of the market's biggest names were taking a beating at midday on Thursday. The mega-cap Magnificent Seven stocks were all down sharply. Here are the moves at 12:10 p.m. ET:
Bonds
The 10-year US Treasury yield continued to slide, dropping 13 basis points early Thursday to its lowest level since October.
The reason behind the move is twofold. First, investors are fleeing the chaos for the relative safety of US government bonds. Second, the plunge in yields shows investors see the Fed lowering interest rates to stimulate the economy while tariffs create headwinds to growth.
Oil
Oil prices also dropped sharply on Thursday. West Texas Intermediate crude fell as much as 7% in the early morning, while Brent crude , the international benchmark, also dropped 6%.
Oil markets have been weighed as traders assess the impact of Trump's tariffs. The decline in prices accelerated on Thursday after an announcement that eight OPEC+ countries plan to accelerate their pace of output hikes starting May, adding to supply expectations.
Read the original article on Business Insider